
It’s that time of the year. A look back at the 2021 statistics for Pennsylvania Craft Beer. As you may know, the Brewers Association releases public data available on beer production on an annual basis. (You can see all past details on PA Beer stats here).
As we reported in 2020, unsurprisingly, Pennsylvania saw a drop in overall production by almost half a million barrels. This should come as no shock as the state was still being impacted by the Covid pandemic.
However, as of 2021, the state would appear to be rebounding. As you can see from the list below, this is the first time overall beer production has seen a yearly increase in six years:
2016: 3,905,620
2017: 3,724,010
2018: 3,719,475
2019: 3,606,444
2020: 3,156,074
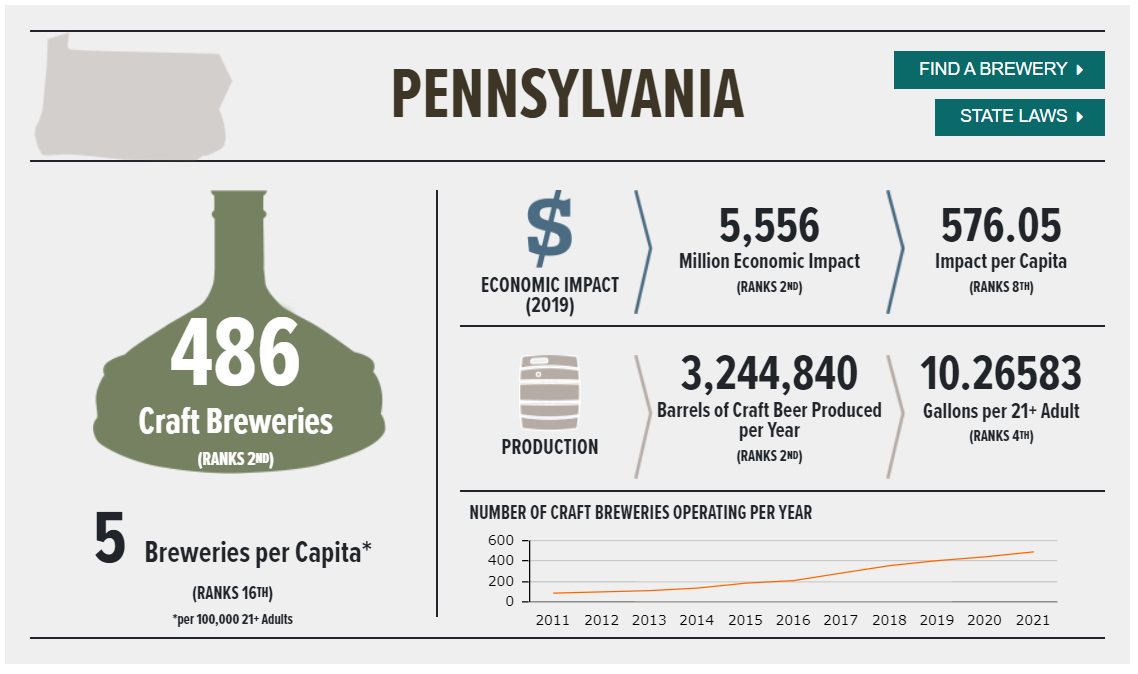
2021: 3,244,840
At 3.2 million barrels of beer produced Pennsylvania continues to find itself in the #2 overall spot throughout the country. For another year, Pennsylvania found itself trailing California for the number 1 spot. With 3.4 million barrels produced, California bested Pennsylvania in just about 200K more barrels of beer produced in 2021 (which is almost the identical separation between these two states from the previous year).
In addition to production, Pennsylvania remained in the top part of the country in many other areas as well. In fact, in most major categories the state ranks no lower than #8. Pennsylvania moved up one spot from last year to the #2 state in the country in economic impact, came in at #4 in gallons per 21+-year-old adult, and #8 in impact per capita. The state moved up one spot to #2 in craft breweries per state. A total of 42 net new breweries were added from 2020 to 2021.
See all of the 2021 stats for yourself:
TRENDING UP AND DOWN
From 2020 to 2021 we saw trends heading in both directions.
Trending Up:
Needless to say, Pennsylvania has seemed to rebound from the pandemic in positive ways. In addition to barrel production being up, we also went from the state with the third most breweries, to second most in the country.
Staying Flat:
Unlike previous years, Pennsylvania didn’t see much of a decrease in a variety of areas, rather a lot of the data stayed flat. The 5.5 million dollars economic impact remained the same from 2020. In addition, the impact per capita remained the same as well.
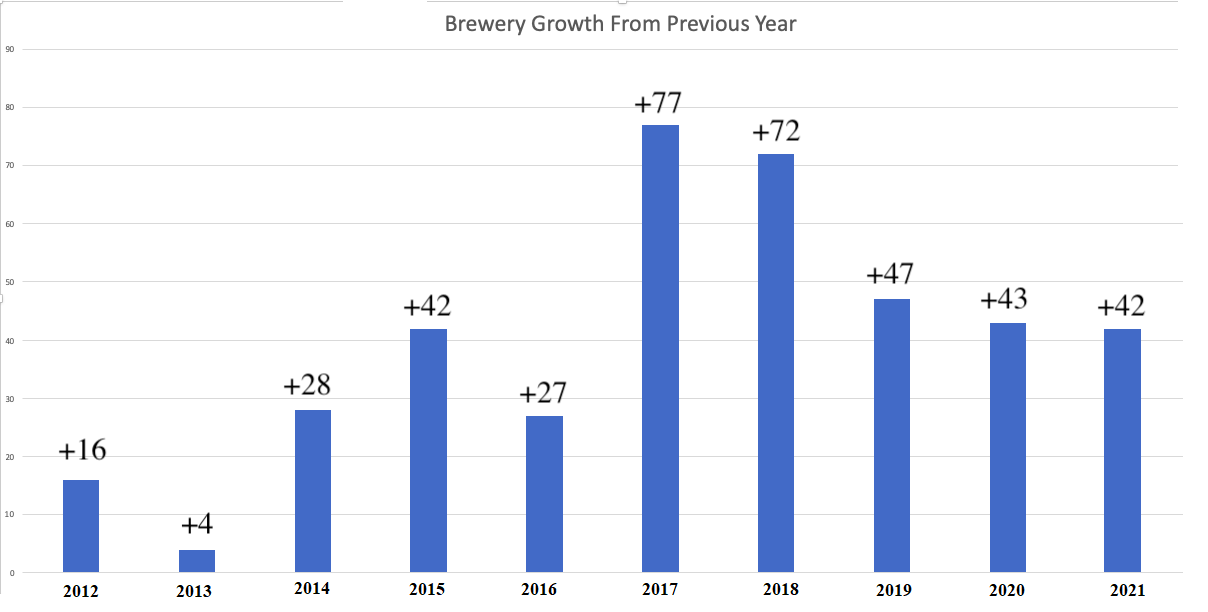
The one area where Pennsylvania did see a dip was in year over year brewery growth, although not by much. As you can see in the chart below, the number of breweries opening year over year in the state has been trending down for the last five years. With 2017 and 2018 being what some could consider “the boom”. However, the lack of brewery growth does seem to be trending more flat having only decreased by 5 in total over the last two years combined.


